¿Y por qué no invierten?
Martes, 21 de Abril del 2015 - 15:52:00
Seis años tras el estallido de la Crisis y aún intentamos entender el por qué de la escasa recuperación de la inversión empresarial en los países desarrollados.
Se podría decir que la inversión empresarial es ahora en los países desarrollados un 25 % inferior a lo que hubiera sido normal en una recuperación económica “modelo” de crisis anteriores (pronósticos). Un peor comportamiento generalizado por áreas y también en tipos de inversión, desde residencial o empresarial.
De hecho, también podríamos hablar de una cierta moderación en el ritmo de crecimiento de la inversión en países en desarrollo. Pero nada que ver con el desplome observado en los países desarrollados.
¿Por qué? La debilidad económica sin duda explica una parte importante de la propia debilidad de la inversión: slack económico e incertidumbre, derivada de la complejidad de la Crisis y del propio mayor deterioro relativo del producto. En el sur de Europa, además, debemos también considerar la propia Crisis financiera (incluida la deuda). ¿Factores sólo cíclicos? Sería demasiado simple verlo de esta forma considerando factores como el envejecimiento, el desarrollo de actividades poco intensivas en capital y hasta la necesidad de una mayor formación (y específica formación).
¿Cómo combatirla? Inversión en infraestructuras como catalizador, pero también combatiendo la restricción financiera y mejorando la visibilidad a medio plazo….¿lo ven posible?
José Luis Martínez Campuzano
Estratega de Citi en España
Martes 21/04/15 libro rojo, subasta de bonos
Re: Martes 21/04/15 libro rojo, subasta de bonos
Oil Tumbles After Saudis Declare End To Yemen Aerial Bombing Campaign
Submitted by Tyler D.
04/21/2015 - 14:24
Saudi Arabia said its campaign of airstrikes in Yemen have succeeded in removing threats to the kingdom and other regional countries, bringing to an end Operation "Decisive Storm." As Bloomberg reports, the Saudi Defense Ministry said a coalition of mostly Sunni Muslim nations has “successfully eliminated the threat to the security of Saudi Arabia and neighboring countries,” by destroying the heavy weaponry and ballistic missiles held by the Shiite Houthi rebels. This comes one day after Gulf envoys told The United Nations that Yemen strikes won't end soon. Saudi Arabia hopes to restart a Yemeni political process and will begin "Operation New Hope," which appears to mean Saudi National Guard ground troops.
- Fenix
- Mensajes: 16351
- Registrado: Vie Abr 23, 2010 2:36 am
Re: Martes 21/04/15 libro rojo, subasta de bonos
Corporate Profits Vaporizing
04/21/2015 15:08
Submitted by Jim Quinn
Hussman has some more brilliant insights this week, which most people will ignore, because we all know he is a perma-bear who only cites facts and historical data to prove how overvalued the stock market is at this point in history. Why should we pay attention to his fact based analysis when the market is up 250 points today? But, in case someone is interested, I’ve picked out the key paragraphs from his weekly letter and I’ve bolded the sentences that make the most important points.
Hussman explains how corporations have been able to maintain record level profit margins. They’ve done it on the backs of taxpayers and the working class. The government transfers and increase in consumer debt (student loans & auto loans) have filled the gap of pitiful wage gains and kept corporate profits at record levels. Thank you Ben, Janet, Obama and a feckless Congress.
Elevated corporate profits since 2009 have largely reflected mirror image deficits in the household and government sectors, as households have taken on debt to maintain consumption despite historically low wages as a share of GDP, and government transfer payments have expanded to fill the gap, with 46 million Americans now on food stamps – a five-fold increase in expenditures since 2000. Essentially, corporations are selling the same volume of output, but paying a smaller share in wages, with deficits in the household and government sectors bridging the gap. As households and government have shoveled themselves further into the hole, corporate profits have climbed higher on the adjacent pile of earth. Deficits of one sector emerge as the surplus of another.
One problem with this scenario. Corporate profit margins always revert back to the long-term mean. The debt based profit bonanza is going into reverse. The strong dollar, increased consumer saving, less entitlement transfers (food stamps, extended unemployment) and continued pitiful real wage growth are combining to take the legs out of the ladder of corporate profits.
In short, corporate profits expand when gross domestic investment is growing strongly, the U.S. current account balance moves toward surplus (more exports, fewer imports), and the sum of household and government savings deteriorates. At present, all of these components are moving in the wrong direction from the standpoint of profit margins. Yet none of these components have moved so far that we would expect that direction to reverse. That’s another way of saying that the ladder that has supported the move to record high U.S. corporate profit margins is beginning to snap. It may be a long way down.
Corporate profits are falling while valuations are at record levels, on par with 1929, 2000, and 2007. Every reliable long-term valuation method reveals the market to be at least 100% overvalued. A Millennial entering the workforce today and investing in the company 401k will likely see the S&P 500 at the same level when they are almost 50 years old as it is today.
Though it’s not widely recognized, measures such as the ratio of market capitalization/nominal GDP and the S&P 500 price/revenue ratio are actually better correlated with actual subsequent total market returns than price/operating earnings ratios, the Fed model, and even the raw Shiller P/E (though the Shiller P/E does quite well once one adjusts for the embedded profit margin). To fully understand the present valuation extreme, recognize that the market cap/GDP ratio is currently about 1.29 versus a pre-bubble norm of just 0.55, with “secular” lows such as 1982 taking the ratio to about 0.33. To fully understand the present valuation extreme, recognize that the S&P 500 price/revenue ratio is currently about 1.80, versus a pre-bubble norm of just 0.8, with “secular” lows taking the ratio to about 0.45.
To put these figures in perspective, if we assume that nominal GDP and corporate revenues will grow perpetually at a 6% nominal rate (which is much faster than we actually observe here), and the market does not experience another secular market low until 2040 – a quarter century from now, the S&P 500 Index would still be approximately unchanged from current levels at that secular low 25 years from today.
But at least you have bonds providing negative real returns across the world. Who wouldn’t want to loan fiscally irresponsible governments run by corrupt politicians and captured central bankers trillions of dollars and you pay them for the privilege of doing so?
One obtains less extreme conclusions, though still uncomfortable, if one assumes that these multiples simply touch their pre-bubble norms a decade from now. In that case, the annual percentage change in the S&P 500 Index over the coming decade would be -2.67% and -2.26%, respectively. If all of this seems preposterous, keep in mind that these revolting long-term prospective returns in stocks are simply a less recognized variant of what we observe more clearly in the bond market, where long-term interest rates are now negative in about one third of the developed world. Investors are literally paying their governments for the privilege of lending to them on a 5-10 year horizon. Investors are collectively out of their minds if they believe that current equity prices don’t quietly reflect the same absurd state of affairs.
In addition to falling corporate profits, obscene overvaluation, and a consumer barely getting by, the economic data for the last three months has been atrocious and continues to worsen by the day. The Atlanta Fed is already showing negative real GDP for the first quarter. Increased consumer spending on Obamacare and food is not a recipe for economic success. The data below proves we are in a recession.
The following chart captures some of our concerns on this front. Manufacturers new orders are now contracting at the fastest rate since the past two recessions. We don’t believe there’s enough evidence to warn of a recession at present, but the data are clearly going in the wrong direction.
We also observe an abrupt contraction in new orders for consumer goods here, shown in the chart below.
I updated our own composite of economic conditions a few weeks ago. The chart below presents a similar index called the ADS Business Conditions Index (h/t the always resourceful Doug Short). While current levels have sometimes been observed outside of recession, our concern again is the abrupt deterioration, and the fact that the data are clearly moving the wrong way.
Today is one of the worst times in the history of the country to be invested in the stock market, bond market, or real estate market. You can ignore the facts, but that doesn’t make them not true. If you believe this is a great time to invest in stocks, you should borrow on margin and buy some Netflix. What could possibly go wrong?
Presently, we observe obscene valuations coupled with evidence of a shift toward increasing risk-aversion among investors. For that reason, I continue to believe that the present moment will likely be remembered among a small handful of the very worst points in history to invest in equities from the standpoint of prospective return and risk.
I can’t overstate that whatever a defensive investor might have “missed” in the late stages of the tech bubble, or the housing bubble, the 2000-2002 decline wiped out the entire total return of the S&P 500 – in excess of Treasury bills – all the way back to May 1996. The 2007-2009 decline wiped out the entire total return of the S&P 500 – in excess of Treasury bills – all the way back to June 1995. The intervening market gains didn’t mean a thing for investors who didn’t act at points of severe overvaluation to realize those gains. Doing so might have been frustrating over the near-term, but the completion of each cycle was ultimately very forgiving about exactly when an investor might have acted, particularly if the defensive action was at a point of market strength and overvaluation.
- Fenix
- Mensajes: 16351
- Registrado: Vie Abr 23, 2010 2:36 am
Re: Martes 21/04/15 libro rojo, subasta de bonos
Ganancias de Verizon mejoran expectativas por aumento de suscripciones
(Reuters) - Las ganancias trimestrales de Verizon Communications Inc superaron las expectativas de los analistas, gracias a un aumento neto de suscriptores de postpago y a la suma de más dispositivos a sus planes de datos.
Las acciones de Verizon subieron un 0,6 por ciento a 49,65 dólares en las operaciones previas a la apertura del mercado.
La mayor compañía de telecomunicaciones inalámbricas de Estados Unidos añadió 565.000 suscriptores minoristas de postpago netos en el primer trimestre que concluyó el 31 de marzo.
Las bajas de clientes en estas cuentas de postpago cayeron al 1,03 por ciento desde el 1,07 por ciento del año anterior.
Los ingresos totales del negocio inalámbrico de la compañía se incrementaron un 6,9 por ciento, a 22.330 millones de dólares.
En su negocio FIOS de productos de video e Internet, las ventas mejoraron un 10,2 por ciento, hasta los 3.350 millones de dólares.
El ingreso promedio por cuenta de los suscriptores de postpago de Verizon descendió de 159,67 a 156,14 dólares.
Las ganancias netas atribuibles a Verizon en el primer trimestre fueron de 4.220 millones de dólares, o 1,02 dólares por acción, comparado con los 3.950 millones de dólares, o 1,15 dólares por acción de un año anterior.
Los ingresos aumentaron a 31.980 millones de dólares desde los 30.820 millones previos.
En promedio, los analistas esperaban beneficios de 95 centavos por acción, con ingresos de 32.270 millones de dólares, según Thomson Reuters I/B/E/S.
- admin
- Site Admin
- Mensajes: 165418
- Registrado: Mié Abr 21, 2010 9:02 pm
Re: Martes 21/04/15 libro rojo, subasta de bonos
Why Europe Lets People Drown
Submitted by Tyler D.
04/21/2015 - 14:00
That Europe let almost 1000 people die in the Mediterranean in one night shouldn’t be a surprise to anyone, at least not to those who are still occasionally awake. The Club Med migrant crisis has been going on for a long time, and the EU’s only reaction to it has been to slash its budget and operations in the area, not to expand them. So when the New York Times opens with “European leaders were confronted on Monday with a humanitarian crisis in the Mediterranean..”, they’re a mile and a half less than honest. Brussels has known what was going on for years, and decided to do less than nothing.
- Fenix
- Mensajes: 16351
- Registrado: Vie Abr 23, 2010 2:36 am
Re: Martes 21/04/15 libro rojo, subasta de bonos
Sabre-Rattling Soars: Poland Buys US Patriot Air Defense System, Gold Pops
Submitted by Tyler D.
04/21/2015 - 13:37
Just days after Russia lifts sanctions on Iran and prepares to send its S-300 missile defense system, it appears Washington has retaliated. As TASS reports, Poland - on Russia's doorstep - has decided to buy the US Patriot air-defense system (made by Raytheon) for a total cost of around $9bn: "The US proposal has been found to be more profitable from the viewpoint of Poland’s security and implementation of commitments within NATO framework." Washington, keen to ensure Warsaw signed up with Raytheon, has decided to loan Poland a battery of Patriots until the deal is signed.
Baker Hughes Cuts 17% Of Workforce As Oil Slump Ripples Through Economy
Submitted by Tyler D.
04/21/2015 - 13:05
Baker Hughes has increased the number of jobs it plans to cut from 7,000 to 10,500 and will close 140 facilities worldwide citing a need to "reduce the cost base and resize [the company's] footprint" in the face of challenging market conditions. Meanwhile, JPM reminds Richard Fisher that "the only thing dropping in the Texas economy is the number of jobs."
BofA Is Confusing Liquidity Fueled And Secular Bull Markets
Submitted by Tyler D.
04/21/2015 - 12:40
Over the past couple of years, there has been a growing chorus of individuals claiming that the financial markets have finally shaken the shackles of the secular bear market that began at the turn of the century. Bank of America is the latest to jump onto the "new secular bull market" bandwagon; but what they miss is that secular bull markets are not born of price, but rather of a set of fundamental metrics that foster sustained economic growth over long periods of time.
Greece May Sign Russia Gas Deal As Soon As Today
Submitted by Tyler D.
04/21/2015 - 12:17
It appears that Herr Schaeuble will be left in the cold disappointed as following comments from the Greek energy minister that a deal is coming "soon," it is being reported that:
*RUSSIA MAY SIGN GAS LINK ACCORD W/ GREECE TODAY: ROSSIYA 24
*GREECE MAY GET LOANS USING RUSSIA GAS TRANSIT GUARANTEE: MILLER
According to Gazprom's CEO comments on Greek TV, following his meeting with Greek PM Tsipras, Russia will guarantee 47BCM/YR of gas via Greece with the link to be built by a Russian-European group at a cost of around €2 billion.
Submitted by Tyler D.
04/21/2015 - 13:37
Just days after Russia lifts sanctions on Iran and prepares to send its S-300 missile defense system, it appears Washington has retaliated. As TASS reports, Poland - on Russia's doorstep - has decided to buy the US Patriot air-defense system (made by Raytheon) for a total cost of around $9bn: "The US proposal has been found to be more profitable from the viewpoint of Poland’s security and implementation of commitments within NATO framework." Washington, keen to ensure Warsaw signed up with Raytheon, has decided to loan Poland a battery of Patriots until the deal is signed.
Baker Hughes Cuts 17% Of Workforce As Oil Slump Ripples Through Economy
Submitted by Tyler D.
04/21/2015 - 13:05
Baker Hughes has increased the number of jobs it plans to cut from 7,000 to 10,500 and will close 140 facilities worldwide citing a need to "reduce the cost base and resize [the company's] footprint" in the face of challenging market conditions. Meanwhile, JPM reminds Richard Fisher that "the only thing dropping in the Texas economy is the number of jobs."
BofA Is Confusing Liquidity Fueled And Secular Bull Markets
Submitted by Tyler D.
04/21/2015 - 12:40
Over the past couple of years, there has been a growing chorus of individuals claiming that the financial markets have finally shaken the shackles of the secular bear market that began at the turn of the century. Bank of America is the latest to jump onto the "new secular bull market" bandwagon; but what they miss is that secular bull markets are not born of price, but rather of a set of fundamental metrics that foster sustained economic growth over long periods of time.
Greece May Sign Russia Gas Deal As Soon As Today
Submitted by Tyler D.
04/21/2015 - 12:17
It appears that Herr Schaeuble will be left in the cold disappointed as following comments from the Greek energy minister that a deal is coming "soon," it is being reported that:
*RUSSIA MAY SIGN GAS LINK ACCORD W/ GREECE TODAY: ROSSIYA 24
*GREECE MAY GET LOANS USING RUSSIA GAS TRANSIT GUARANTEE: MILLER
According to Gazprom's CEO comments on Greek TV, following his meeting with Greek PM Tsipras, Russia will guarantee 47BCM/YR of gas via Greece with the link to be built by a Russian-European group at a cost of around €2 billion.
- Fenix
- Mensajes: 16351
- Registrado: Vie Abr 23, 2010 2:36 am
Re: Martes 21/04/15 libro rojo, subasta de bonos
Saudi Arabia Orders Its National Guard To Enter Yemen War
Submitted by Tyler D.
04/21/2015 - 12:01
Over the better part of the past month, the only entities actively involved in the proxy war in Yemen against the local Houthi rebel force have been air force units, mostly under Saudi command as part of Operation "Decisive Storm." Which probably explains why there has been little if any progress to note in pushing back said rebellion which, armed heavily thanks to the US government, has successfully managed to push the current president into an indefinite exile. That changed hours ago, when Saudi Arabia's King Salman ordered the Saudi Arabian National Guard, widely regarded as the kingdom's best equipped military ground force, to take part in Riyadh's campaign against Iran-allied Houthi rebels in Yemen.
Bill Gross Says Bunds "Short Of A Lifetime", As Mario Draghi Is About To Run Out Of Bunds To Buy
Tyler D.
04/21/2015 10:45
By now everyone has seen the infamous chart showing how much of Europe's government bond market is trading in negative territory.
This is simply a visual representation of three stunning facts:
* As of this moment 53% of all global government bonds yielding 1% or less.
* $5.3 trillion of all global government bonds currently have negative yields, of which 60% are European.
* and Central bank assets now exceed $22 trillion, a figure equivalent to the combined GDP of US & Japan.
Considering that central banks aren't going anywhere in their frenzied scramble to re-export deflation to their peers, which means trillions more in debt monetizations (until they all lose patience, or credibility, whichever comes first and start paradropping money from Bernanke's chopper) the statistics above are only going to get worse.
It is in this context that moments ago, Bill Gross said that "German 10 year Bunds are the short of a lifetime...
Gross: German 10yr Bunds = The short of a lifetime. Better than the pound in 1993. Only question is Timing / ECB QE
— Janus Capital (@JanusCapital) April 21, 2015
... however with the provision that there is one open question: timing and ECB QE (also, we can only guess that Gross means 1992 not 1993 for the pound move).
Of course, that is the $5.3 trillion question.
In the meantime, here are some observations on timing and ECB QE.
As we noted over a month ago on March 6, what will first happen before Bunds are indeed "a short of a lifetime" is that they will first all hit -0.20%. They are already well on their way.
The reason? The same one we have been pounding the table on for over three years - Europe simply does not have enough unencumbered collateral for the ECB monetize, and certainly not enough to allow the ECB to continue its QE until late 2016.
And little by little everyone is figuring this out.
Today, it's Reuters' turn which write that "Debt redemptions and coupon repayments are expected to be about 30 billion euros more than the value of debt sales."
Reuters continues:
This means the ECB and national central banks (NCBs) may struggle to buy some of the bonds needed to keep the maturity of the banks' purchases in line with the average maturity of each country's eligible debt. The markets with the biggest net inflows this month are Spain, Germany and the Netherlands.
"This month's low net supply figure is not helpful to the ECB/NCB aim to minimise market distortions when carrying out QE, as there could be competing flows with investors wanting to reinvest in European government bonds," said Orlando Green, rate strategist at Credit Agricole.
What this means is that far from being the short of a lifetime right now, Bunds are in fact quite the opposite, and their progression to the hard -0.20% floor across the curve is just a matter of time before everyone decides to frontrun the ECB's purchases over the next year. Because if the ECB will have no choice but to buy even more Bunds from the private market, then the sellers can demand any prices for these Bunds, up to and including the ECB's hard (for now) floor of -0.20%!
Indeed, confirming that the ECB has a scarcity problem is the ECB's stern denial of just that: "ECB President Mario Draghi said last week he saw no "scarcity" problem in bond markets."
Let's revisit when the 10Yr Bund is trading at -0.20%, shall we?
Meanwhile, the only question is when the benchmark Bund finally crosses the historic 0.00% threshold. There is a brief reprieve in the coming two months...
The redemption flow in euro zone bond markets may exacerbate some of these problems in April but these difficulties may ease in the next two months. Debt sales in Italy and France in particular will outweigh debt repayments in May, Credit Agricole data shows.
... After which things get very ugly, fast:
It will be a bumpy road though -- a net 69 billion comes back to the market in July. So far under its programme, which began on March 9, the ECB has bought 73.3 billion euros of public sector bonds.
If ECB purchases are not market-neutral, investors may take the opportunity to speculate on what the central bank will buy in any given month, on the view that it will have to revert to neutrality by the end of the programme in September 2016.
Visually, the above looks as follows:
Of course, if Greece has anything to do with it, this ECB's "market neutrality" will be compromised much faster: should the Greek capital controls and bank run be exacerbated in the coming days, primarily as a result of the ECB's own ongoing attempt to spark a banking sector panic in Greece, then the 10 Year Bund may slide under 0.00% in the coming days, on its way to -0.20%.
And yes, once the entire German curve is trading at -0.20% then Bill Gross will be spot on, and Bunds will indeed be the short of a lifetime.
Just don't expect to pocket the proceeds any time soon because, paradoxically, for that to happen, central banks have to finally lose all credibility. And the fiat in which one will enjoy the profits from the Bund short may suddenly not be worth all that much in a post central-bank world.
- Fenix
- Mensajes: 16351
- Registrado: Vie Abr 23, 2010 2:36 am
Re: Martes 21/04/15 libro rojo, subasta de bonos
White House Refutes European Complacency: Warns Grexit Threatens Global Economic Recovery
Submitted by Tyler D.
04/21/2015 - 10:19
Despite our exposure of the contagious risk increases in peripheral bond spreads, "many European officials believe a Greek exit would be manageable, and in contrast to 2010-2011, we wouldn’t see the same cascading effect on countries like Spain or Ireland,” according to the European Centre for International Political Economy in Brussels and EU Chair Jeroen Djisselbloem even noted that "the Greek situation can be isolated." It appears America is getting nervous at Europe's apparent complacency... White House economic adviser Jason Furman says a Greek exit from the euro zone would present "VERY LARGE AND UNNECESSARY RISK FOR GLOBAL ECONOMY."
European Banks Are Paid To Borrow For First Time Ever As Euribor Goes Negative
Submitted by Tyler D.
04/21/2015 - 09:08
Mario Draghi said this week that the transmission channels for European Q€ were opening up and crowed how well his cunning plan was working (by well we assume he means stocks are up). Today we get the ultimate test of that 'transmission' as 3-Month EURIBOR fell below 0.00% for the first time ever (likely wreaking havoc on European derivative pricing models). In English that means banks are being paid to borrow from one another in the interbank money-markets (which sounds a lot like a 'glut' of excess cash) seemingly confirming ICMA's de Vidts fears: "We are scared about the [repo] market freezing," as the ECB is "driving without headlights in the dark." Of course this is yet another disturbing distortion on the heels of homeowners being paid to take out mortgages...
Egypt's Clinton-Backed Former President Jailed For 20 years
Submitted by Tyler D.
04/21/2015 - 09:15
Deposed former Egyptian President Mohammed Morsi was sentenced to 20 years in prison today in connection with a crackdown on protesters during demonstrations against his rule in late 2012. Morsi assumed the Presidency in 2012 after Hosni Mubarak was toppled a year earlier during the Arab Spring. Morsi's "democracy" lasted all of 4 months before he granted himself special autocratic powers triggering unrest that would eventually lead the military to assume power.
First Chinese State-Owned Firm Defaults On Its Bonds
Submitted by Tyler D.
04/21/2015 - 07:50
In what may be a harbinger of things to come and in a sign that Beijing will allow the market to play a greater role in determining companies’ financial future, a subsidiary of China South Industries Group has missed a coupon payment, marking the first default by a Chinese state-owned firm.
Submitted by Tyler D.
04/21/2015 - 10:19
Despite our exposure of the contagious risk increases in peripheral bond spreads, "many European officials believe a Greek exit would be manageable, and in contrast to 2010-2011, we wouldn’t see the same cascading effect on countries like Spain or Ireland,” according to the European Centre for International Political Economy in Brussels and EU Chair Jeroen Djisselbloem even noted that "the Greek situation can be isolated." It appears America is getting nervous at Europe's apparent complacency... White House economic adviser Jason Furman says a Greek exit from the euro zone would present "VERY LARGE AND UNNECESSARY RISK FOR GLOBAL ECONOMY."
European Banks Are Paid To Borrow For First Time Ever As Euribor Goes Negative
Submitted by Tyler D.
04/21/2015 - 09:08
Mario Draghi said this week that the transmission channels for European Q€ were opening up and crowed how well his cunning plan was working (by well we assume he means stocks are up). Today we get the ultimate test of that 'transmission' as 3-Month EURIBOR fell below 0.00% for the first time ever (likely wreaking havoc on European derivative pricing models). In English that means banks are being paid to borrow from one another in the interbank money-markets (which sounds a lot like a 'glut' of excess cash) seemingly confirming ICMA's de Vidts fears: "We are scared about the [repo] market freezing," as the ECB is "driving without headlights in the dark." Of course this is yet another disturbing distortion on the heels of homeowners being paid to take out mortgages...
Egypt's Clinton-Backed Former President Jailed For 20 years
Submitted by Tyler D.
04/21/2015 - 09:15
Deposed former Egyptian President Mohammed Morsi was sentenced to 20 years in prison today in connection with a crackdown on protesters during demonstrations against his rule in late 2012. Morsi assumed the Presidency in 2012 after Hosni Mubarak was toppled a year earlier during the Arab Spring. Morsi's "democracy" lasted all of 4 months before he granted himself special autocratic powers triggering unrest that would eventually lead the military to assume power.
First Chinese State-Owned Firm Defaults On Its Bonds
Submitted by Tyler D.
04/21/2015 - 07:50
In what may be a harbinger of things to come and in a sign that Beijing will allow the market to play a greater role in determining companies’ financial future, a subsidiary of China South Industries Group has missed a coupon payment, marking the first default by a Chinese state-owned firm.
- Fenix
- Mensajes: 16351
- Registrado: Vie Abr 23, 2010 2:36 am
Re: Martes 21/04/15 libro rojo, subasta de bonos
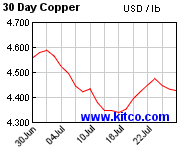
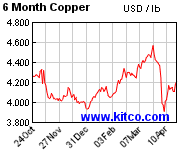
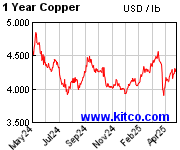
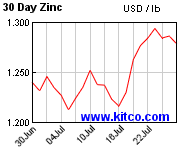
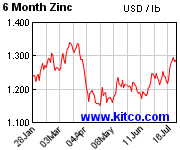
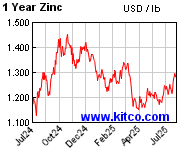
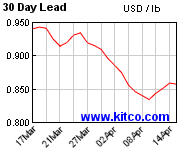
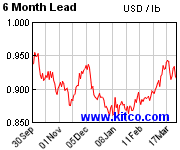
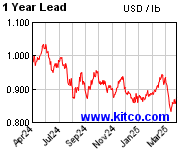
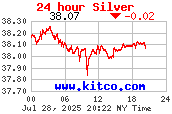
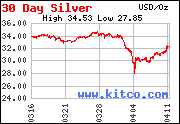
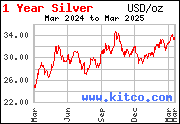
Los gráficos del día, 
.

.

.

.
.
.
.


.


.


.


.


.
- Comodoro
- Mensajes: 980
- Registrado: Jue May 06, 2010 8:24 am
- Ubicación: LIMA
¿Quién está conectado?
Usuarios navegando por este Foro: No hay usuarios registrados visitando el Foro y 8 invitados
